It is basically the value that defines the upper and lower bounds of a confidence interval. It tells that to complete a few amounts of the total variation in the data how you will go from the mean of the distribution. For example, 90%, 95%, 99%, etc.
Moreover, in this article, the basic definition of critical value and its types will also be discussed and for better understanding examples will also be provided.
Definition of critical value
In statistical hypothesis testing, the critical values of a statistical test are the boundaries of the acceptance region of the test.
The critical value is the same if you can use a 95% confidence interval or using statistical significance p=0.05. it is also used to check whether the output is statistically significant or not. Critical values in confidence intervals are used to determine the lower limits and upper limits.
Formula of critical value
Critical Value = 1 – (alpha (α) / 2) where α = 1 – (confidence level / 100)
One-tailed test vs Two-tailed test
The one-tailed test basically tells sample mean would be higher or lower than the population means in a hypothesis test.
A two-tailed test tells a sample greater or less than the total outputs of values for both sides of a particular data range.
Confidence interval for Critical Value
The critical value can be calculated using a confidence interval for a one-tailed and two-tailed test. Let a confidence interval of 99% has been specified for conducting a hypothesis test. The critical value can be evaluated by following these steps:
- First, subtract the confidence level from 100%. 100% – 99% = 1%
- Change it to decimals to get α. So, α = 1%
- In a one-tailed test, alpha level will be the same value 1%. But, if it is a two-tailed test, the alpha level will be calculated by dividing 2 by the alpha value.
- Now lastly it depends on the type of test conducted the critical value can be looked up from the corresponding distribution table using the alpha value.
Decision Criteria:
- Accept the null hypothesis if the test statistic > t critical value (left-tailed hypothesis test).
- Accept the null hypothesis if the test statistic < t critical value (Right-tailed hypothesis test).
- Accept the null hypothesis if the test statistic does not lie in the rejection region (two-tailed hypothesis test).
Example Section
In this section, the critical value will be calculated with the help of examples by using formulas.
Example 1:
Evaluate the critical value by a left-tailed z-test where α is 0.05.
Solution:
Initially, subtract the α value from 0.5.
0.5 – 0.05 = 0.45
Now looking at the z-distribution table, z = 1.645
As it is for the left-tailed z test then the critical value will be, z = -1.645
Critical value = -1.645
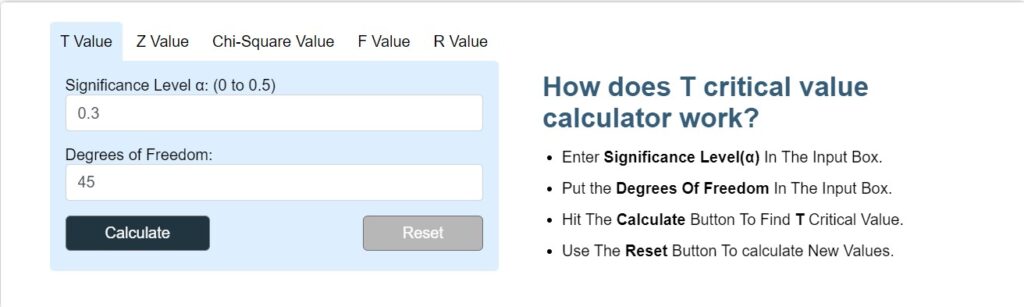
The problems of critical values can be evaluated with the help of a critical value calculator to get accurate result in no time.
Example 2:
Evaluate the critical value for a two-tailed F-test table by using α = 0.1 on the samples given below
Sample size = N1= 46
Sample size = N2 = 91
Solution:
Step 1: Extract the data
Sample Size = N1 = 46,
Sample Size = N2 = 91,
Step 2: Calculate the degree of freedom
For Sample 1:
N1 – 1 = 45
Degree of freedom (df) = 45
For Sample 2:
N2 – 1 = 90
Degree of freedom (df) = 90
Now looking on F-distribution table using α = 0.1, the value will be chosen where the 45th column and 90th row mean that is F (45, 90) = 0.6401 & 1.5079
Thus, given answer = 0.6401 & 1.5079
Example 3:
Find the critical if a one-tailed t-test table is under observation on data having sample size 8 and α is 0.01.
Solution:
Step 1: Extract the data
Sample size = n = 9
Step 2: Calculate the degree of freedom
To obtain a degree of freedom we use the formula
Degree of freedom = n – 1
Degree of freedom = 9 – 1 = 8
Using one-tailed t distribution table you get to know that t (8, 0.01) = 2.8965
Thus, Critical Value = 2.8965
Example 4:
Evaluate the critical value for a two-tailed f test by using α = 0.2 on the samples given below
Sample size = n1 =44
Sample size = n2 =33
Solution:
Step 1: Extract the data
n1 = 44,
n2 = 33,
Step 2: Calculate the degree of freedom
For Sample 1
n1 – 1 = 43
Degree of freedom = 43,
For Sample 2
n2 – 1 = 32
Degree of freedom = 32
F-distribution table using for α = 0.2, the value will be chosen where the 43rd column and 32nd row mean that is F (43, 32) = 0.6585 & 1.5490
Critical Value = 0.6585 & 1.5490
Example 5:
Determine the critical value if a one-tailed t-test is under observation on data whose sample size is 5 and α is 0.05.
Solution:
Given data
Sample size = n = 5
To obtain a degree of freedom we use the formula
Degree of freedom = n – 1
Degree of freedom =5 – 1 = 4
Using a one-tailed t-distribution table you get to know that t (4, 0.05) = 2.1319.
Thus, the required answer = 2.1319.
Conclusion:
In this article, we have discussed a slight introduction to the term “critical value”. After that, we discussed the basic definition and the types of tests we do to calculate the critical value. We have read the comparison between one-tailed and two-tailed tests. In the example section, we have discussed the step-by-step solution for calculating the confidence interval and degree of freedom. The critical value is not a difficult topic you can easily solve the problems related to it after reading this article.
 and Human Intelligence (Hi):")

")
